According to the information available on the website of Latvian Environment, Geology and Meteorology Centre (hereinafter – LEGMC), starting from May 2025 the following months were rich in precipitation, in some regions repeatedly exceeding the monthly precipitation norm.

LEGMC information on spring precipitation: At the end of the second ten-day period of April, intense precipitation was observed, especially in the central districts (in Lielpeči on April 19th, 76.3 mm of rainfall was recorded), and also afterwards in late April and the first half of May rain was observed from time to time.

In mid-May, prolonged rainfall was registered almost throughout Latvia, with the highest amounts in Madona, Kalnciems, and Riga. While in Kurzeme, western Vidzeme, and the central regions of the country the precipitation amount was relatively low until the end of May. In Latgale, Sēlija, and eastern Vidzeme the rain did not stop, making May very wet in these regions. In Madona, where more than three times the monthly norm rained, this was the wettest May in the history of observations.

Table 1: This chart shows the precipitation levels in Latvia during spring 2025 (march, april and may). The black line represents size of precipitation. The colored area (orange to green) shows how much wetter or drier it was compared to the long-term norm (orange = drier, green/blue = wetter). The grey bars at the bottom indicate daily average precipitation amounts in Latvia. Overall, it shows that March and early April were drier than normal, but in the second half of April and May precipitation increased significantly, becoming wetter than the long-term average.

According to information from LEGMC, May 2025 was cold and rich in precipitation. The total amount of precipitation in Latvia in May was 84.7 mm, which is 68% above the monthly norm (50.4 mm). The heaviest rainfall was recorded in the central and eastern parts of the country, in many places reaching twice and in some regions even four times the May norm. The highest precipitation (194.3 mm) was in Madona, while the lowest was in Kolka – 24.8 mm. On average, Latvia had 10.8 days in May with at least 1 mm of precipitation. The highest number of rainy days was in Gulbene, Madona, and Zīlāni – 18 days, while the lowest was in Pāvilosta and Ventspils – four days.

Table 2: This map shows how rainfall in Latvia during May 2025 differed from the 1991–2020 average. Yellow = less rain than normal. Green/blue = more rain than normal. West part had a deficit, but East/central part had a surplus.

Information on the situation in Latvian rivers in May 2025.

In May, the amount of precipitation observed in river basins was generally higher than the long-term average. In Venta and Ogre basins, the observed precipitation exceeded the long-term average – reaching 136% and 195% of the monthly norm, respectively.

Meanwhile, an even greater amount of precipitation was observed in Daugava basin in the territory of Latvia, as well as in Gauja, Lielupe, and Aiviekste basins: 231–288% of the monthly norm. In the middle reaches of Daugava basin in Belarus, May was also very wet, with several observation stations recording precipitation above the monthly norm for May.


Table 3: This chart shows total rainfall vs. normal rainfall in Latvia’s river basins for May 2025. Light blue = actual rainfall. Dark blue = long-term average (normal). Ogre basin had much more rain than normal, while Irbe basin had much less.

In Aiviekste, Dubna, and Venta basins, the average river runoff in May was closer to the long-term average indicators or slightly above them: 96–101% of the norm. Meanwhile, the average river runoff for the month in Lielupe, Gauja, Bārta, and Ogre basins was considerably above the long-term average indicators: 113–180% of the norm.

Table 4: This chart shows the average and maximum river water discharges in Latvia for May 2025 at different monitoring points (Daugava, Jēkabpils, Aiviekste, Bārta, etc.). It compares three values for each site: Maximum discharge (light blue), Long-term norm (medium blue), Average discharge (dark blue).

In most rivers of Latvia, water level changes in the first half of May had no pronounced peaks and the fluctuation amplitude was small, but in the second half of the month a wetter period set in, with widespread rainfall, often very intense, especially in the central and eastern parts of Latvia.

Due to the precipitation, water levels in the rivers of the eastern part rose rapidly, flooded floodplains and lowlands, as well as rural areas. In the third decade of the month, yellow-level warnings were issued for high water levels in the central-eastern regions of Latvia.

Table 5: This chart shows changes in maximum river water levels in Latvia during May 2025. It tracks water level dynamics for several rivers and locations. Each colored line represents one river, showing how its maximum daily water level changed throughout the month.

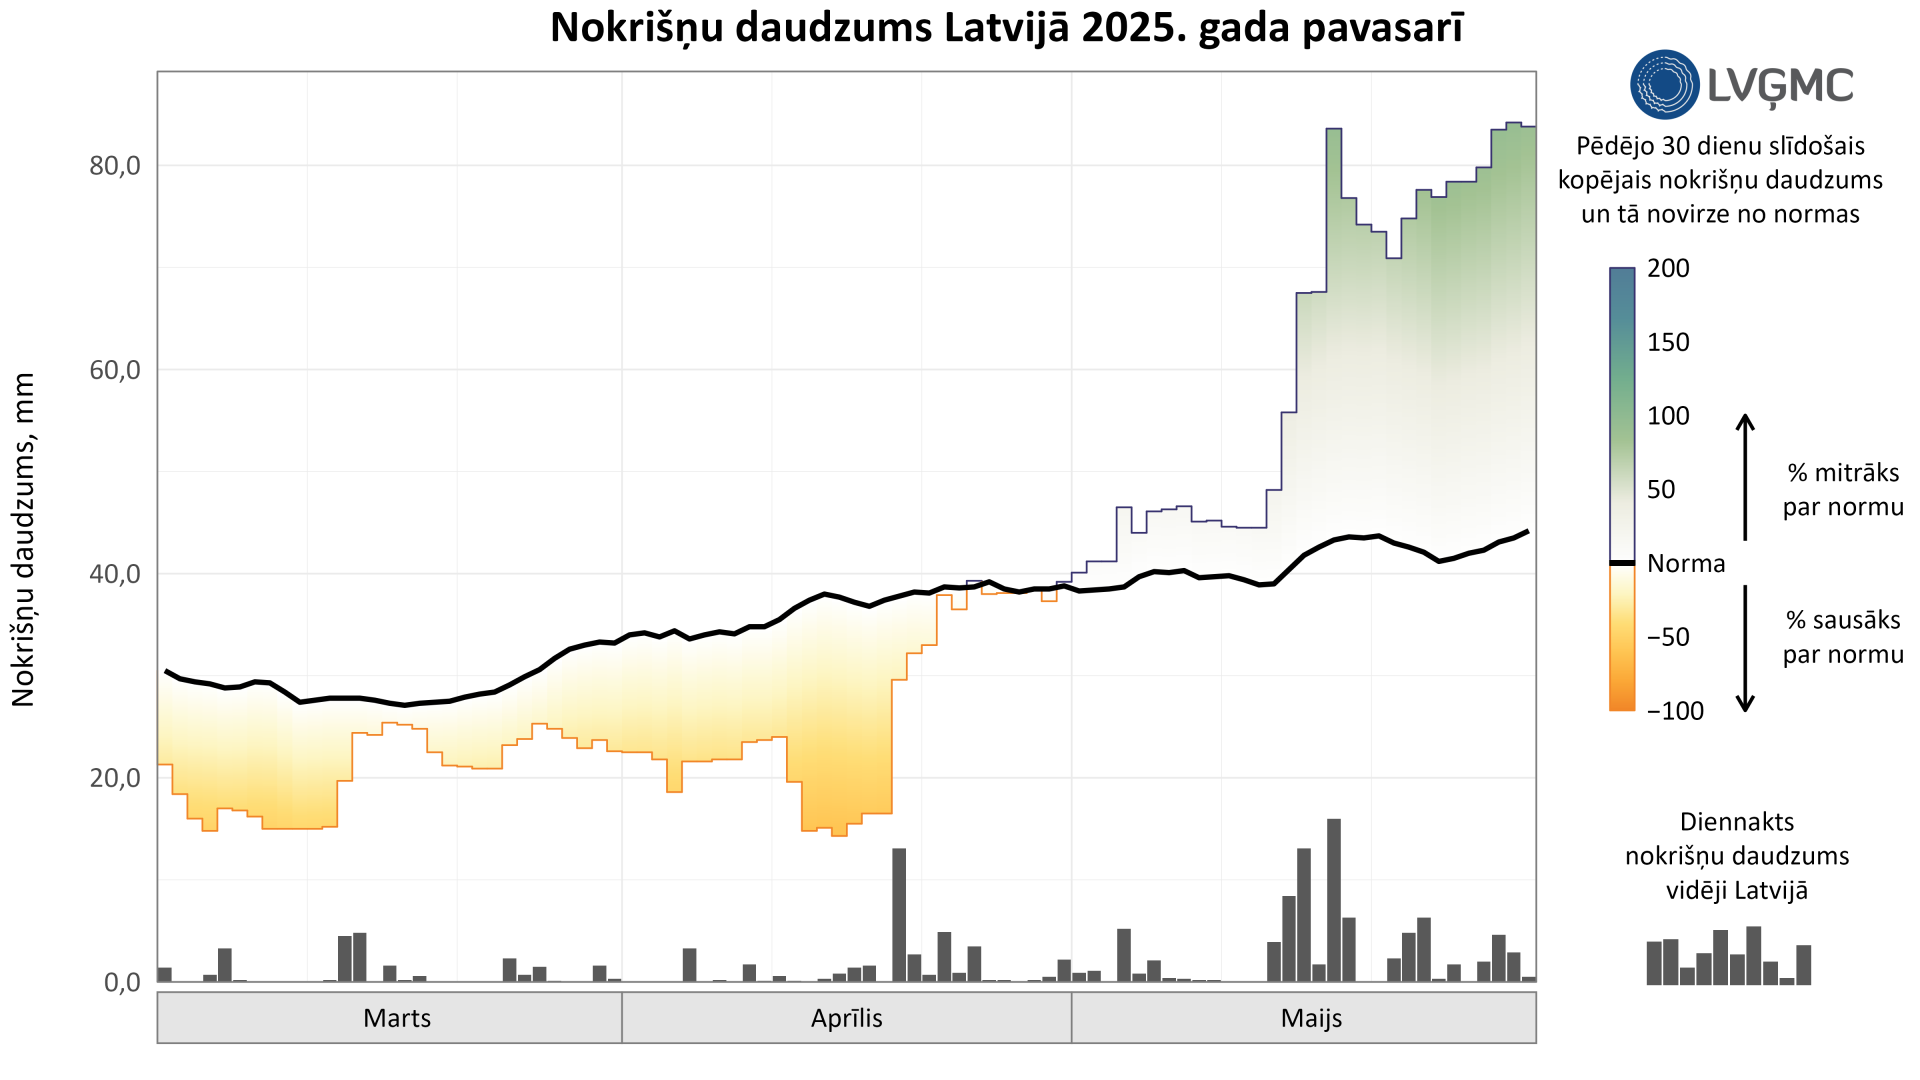
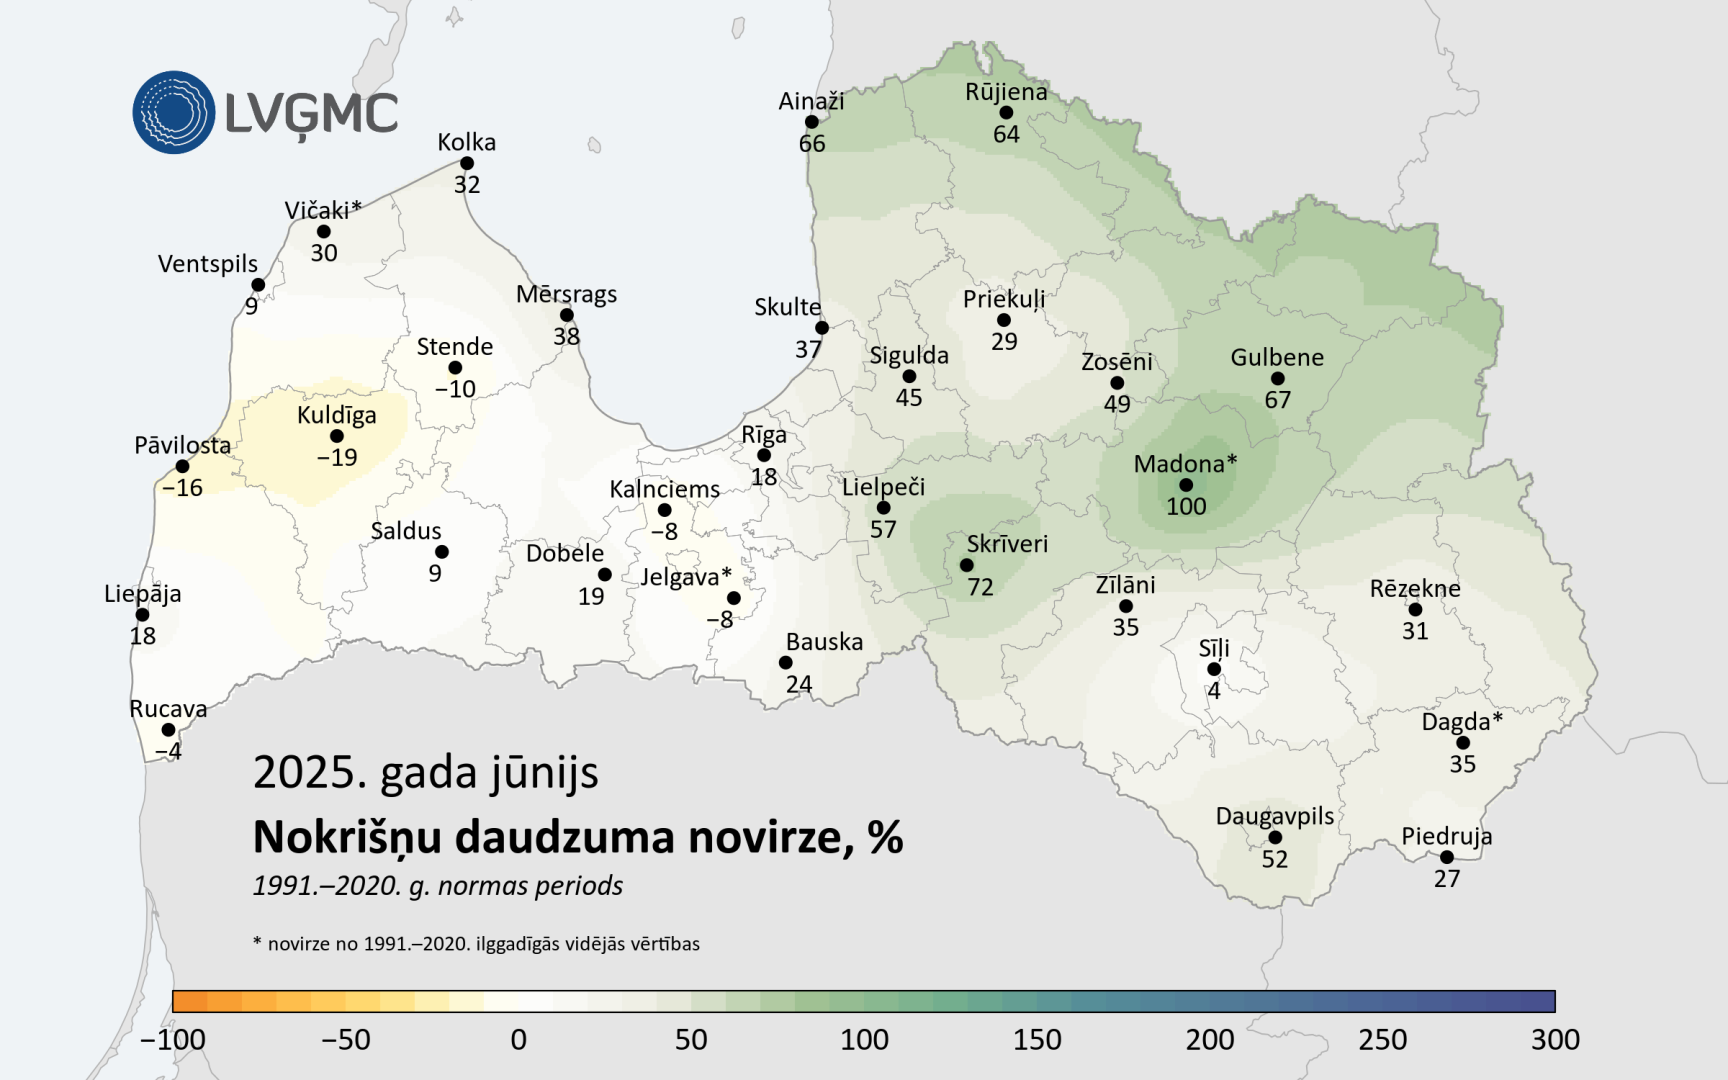
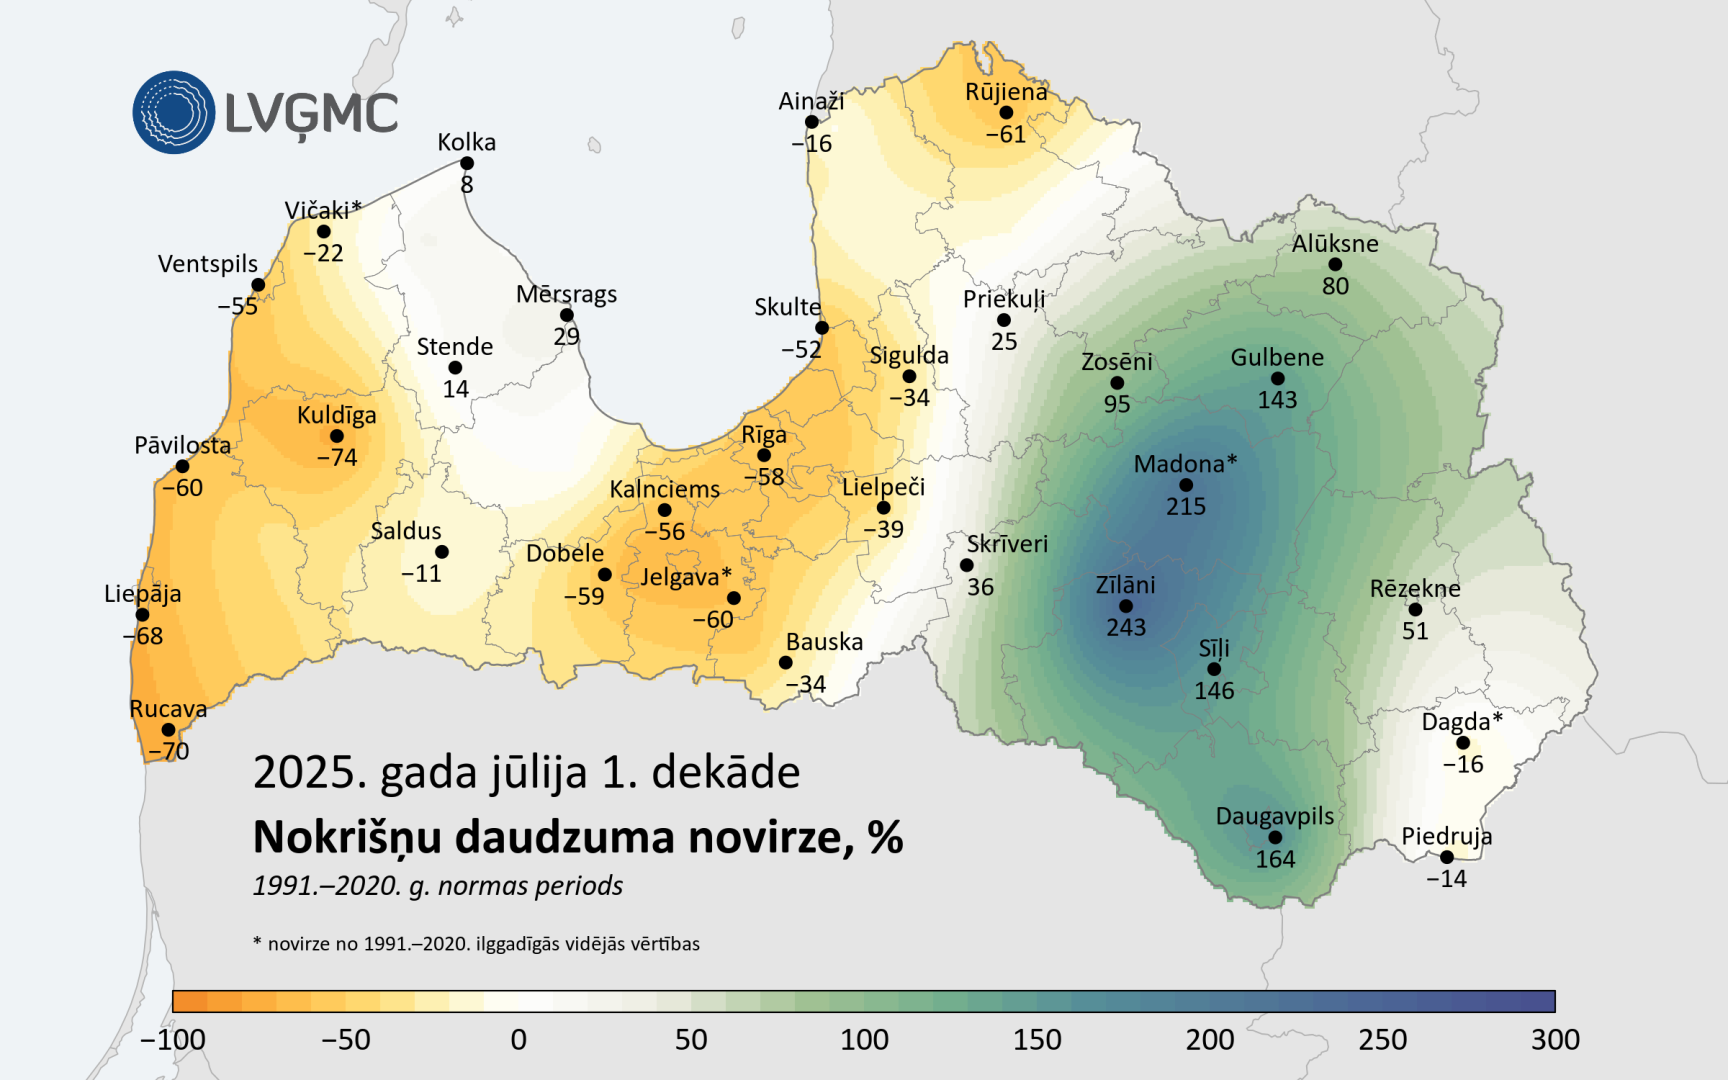
According to information from LEGMC, the situation did not improve in June, when the total amount of precipitation in Latvia was 91.1 mm, which is 30% above the monthly norm (70.1 mm), in some places even exceeding it twice. The highest amount of precipitation (146.5 mm) was recorded in Madona, while the lowest was in Pāvilosta – 42.9 mm. On average, Latvia had 13.9 days in June with at least 1 mm of precipitation. The most such days were in Gulbene – 18 days, and the fewest in Pāvilosta – eight days.

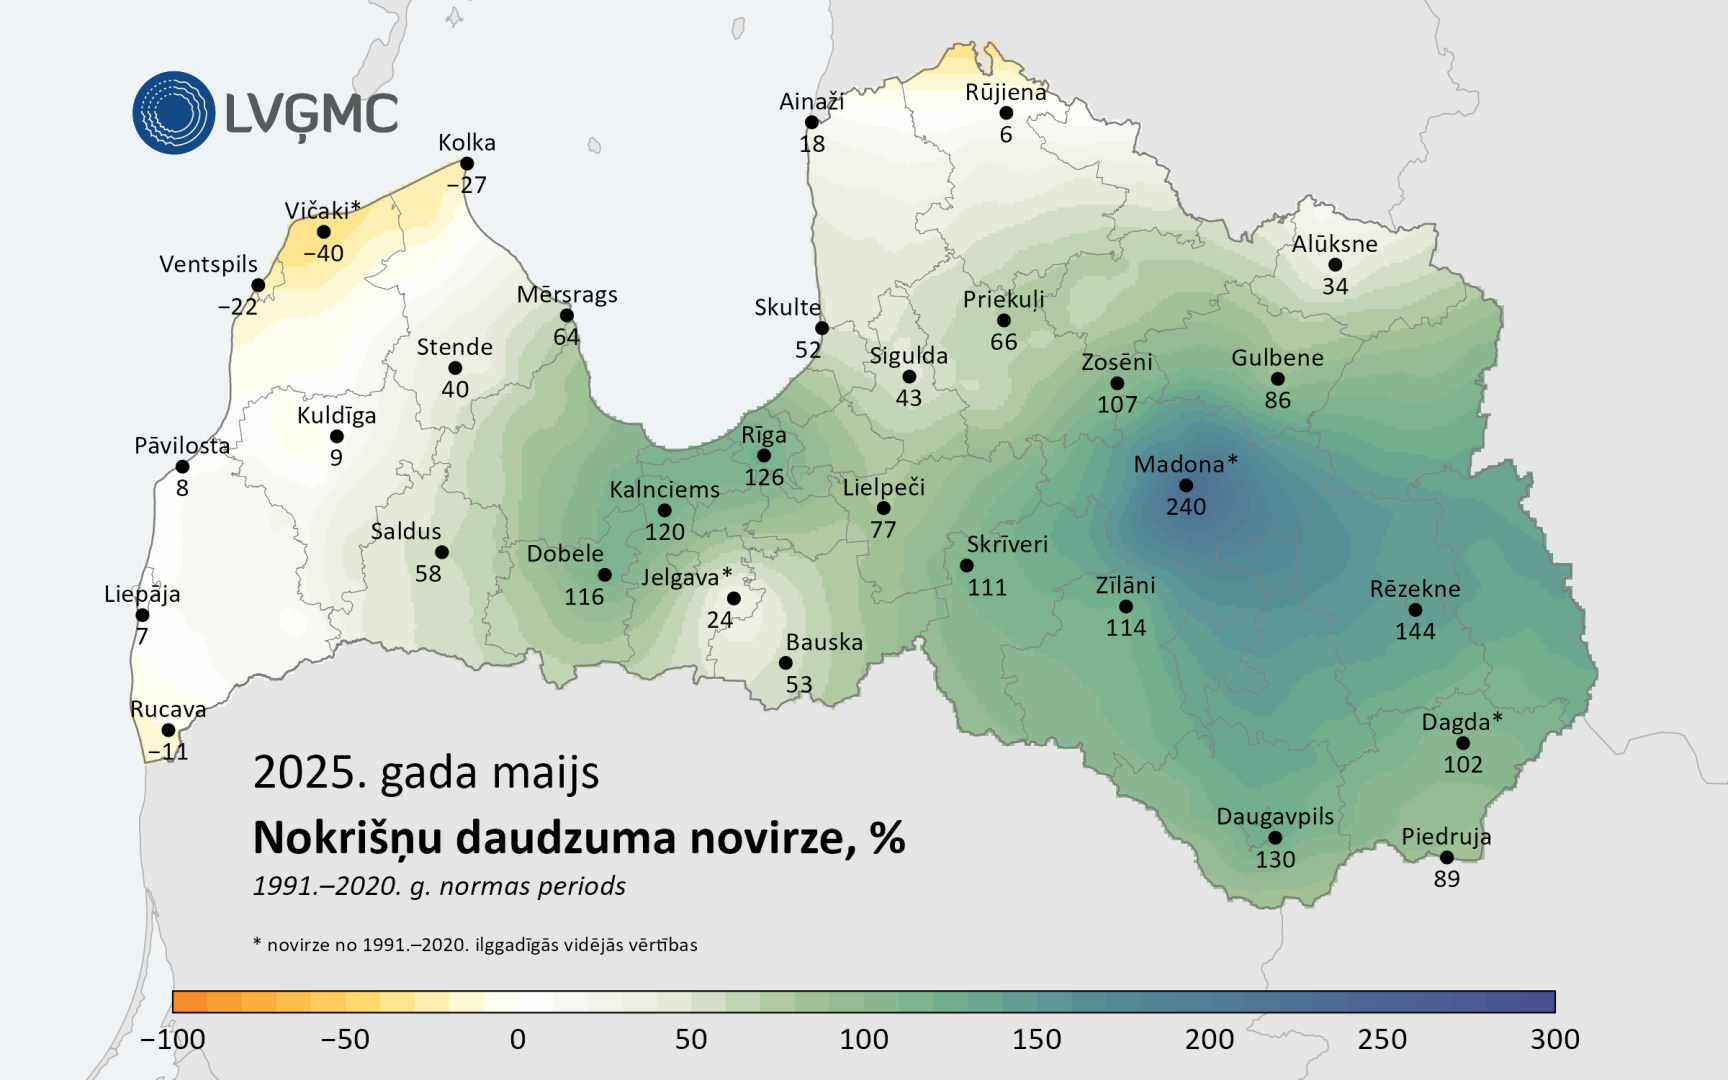
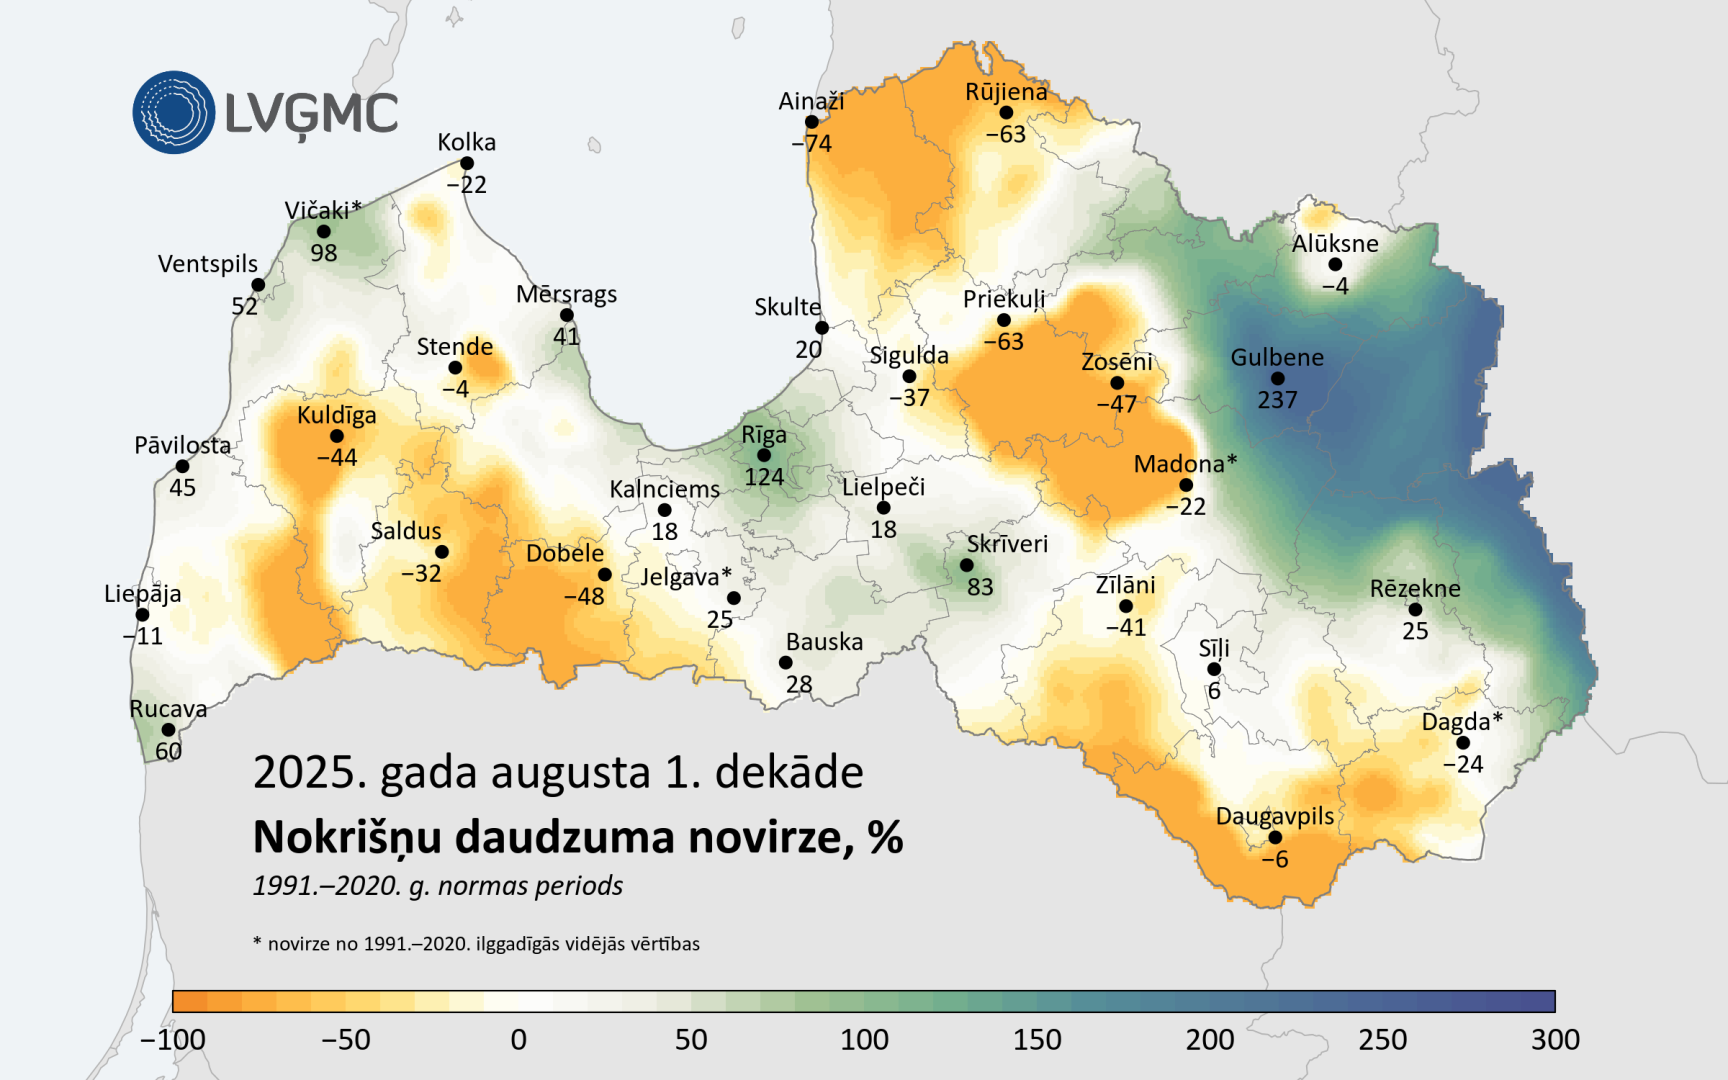
Table 6: This map shows deviation of precipitation in June 2025 compared to the 1991–2020 climate norm in Latvia (expressed as a percentage). Green areas had significantly higher rainfall than usual. Yellow/orange areas had below-average rainfall. June 2025 was wetter than average in most of Latvia, especially the east and center, but drier in the west.

Information from LEGMC on the situation in Latvian rivers in June 2025.

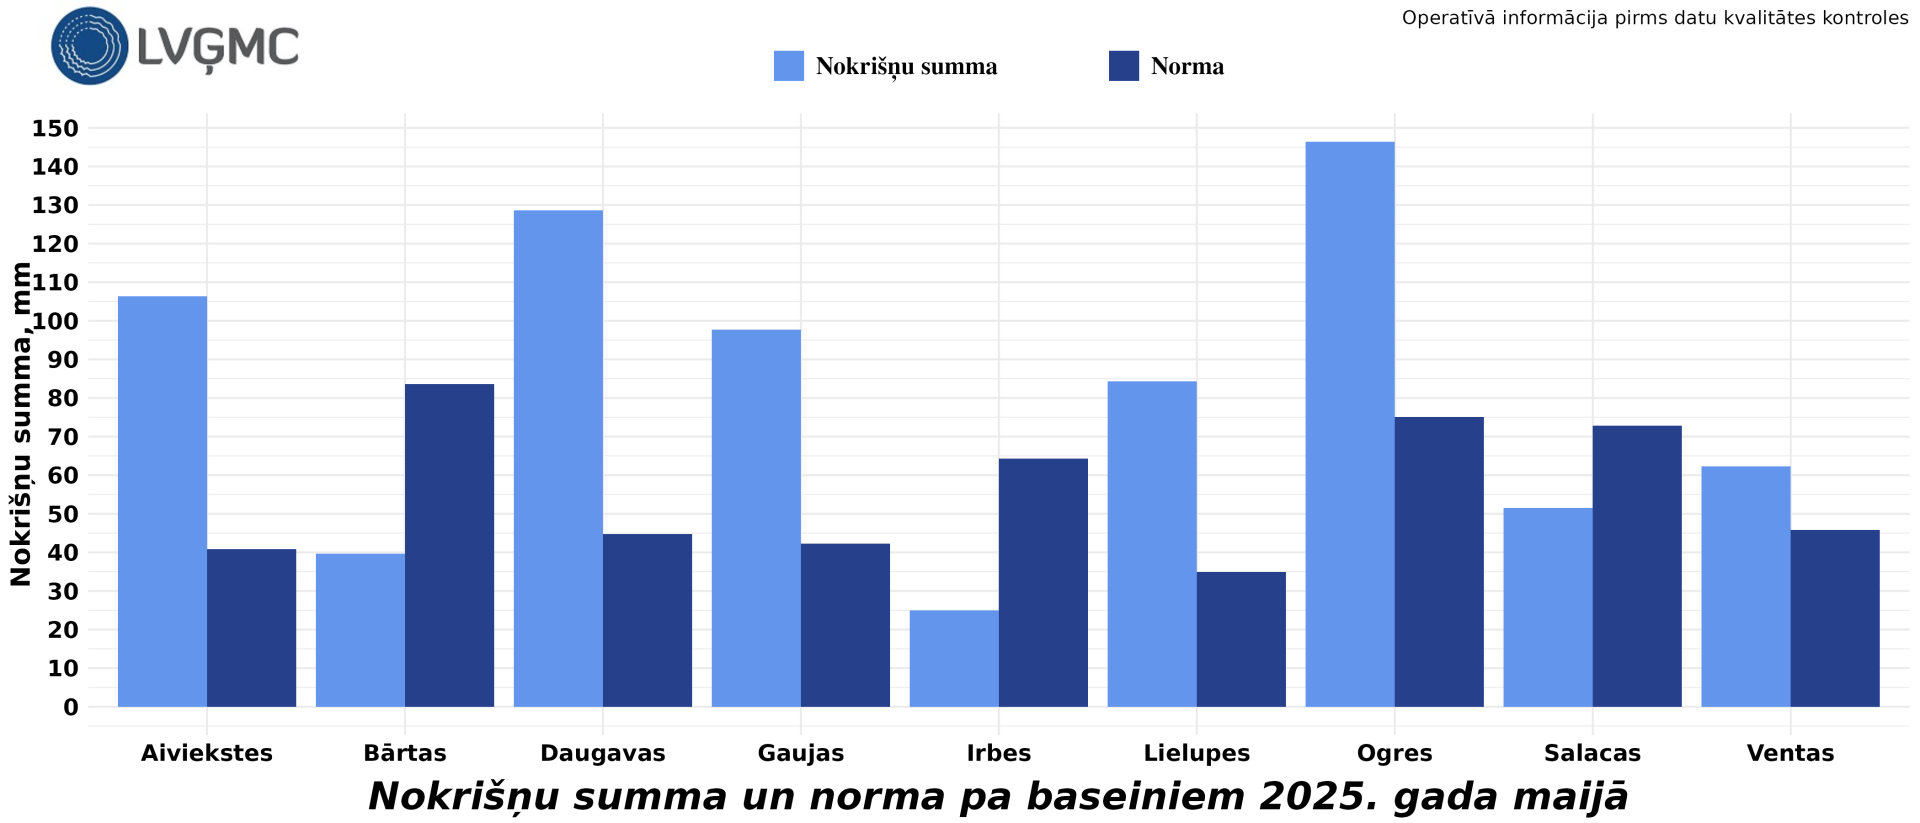
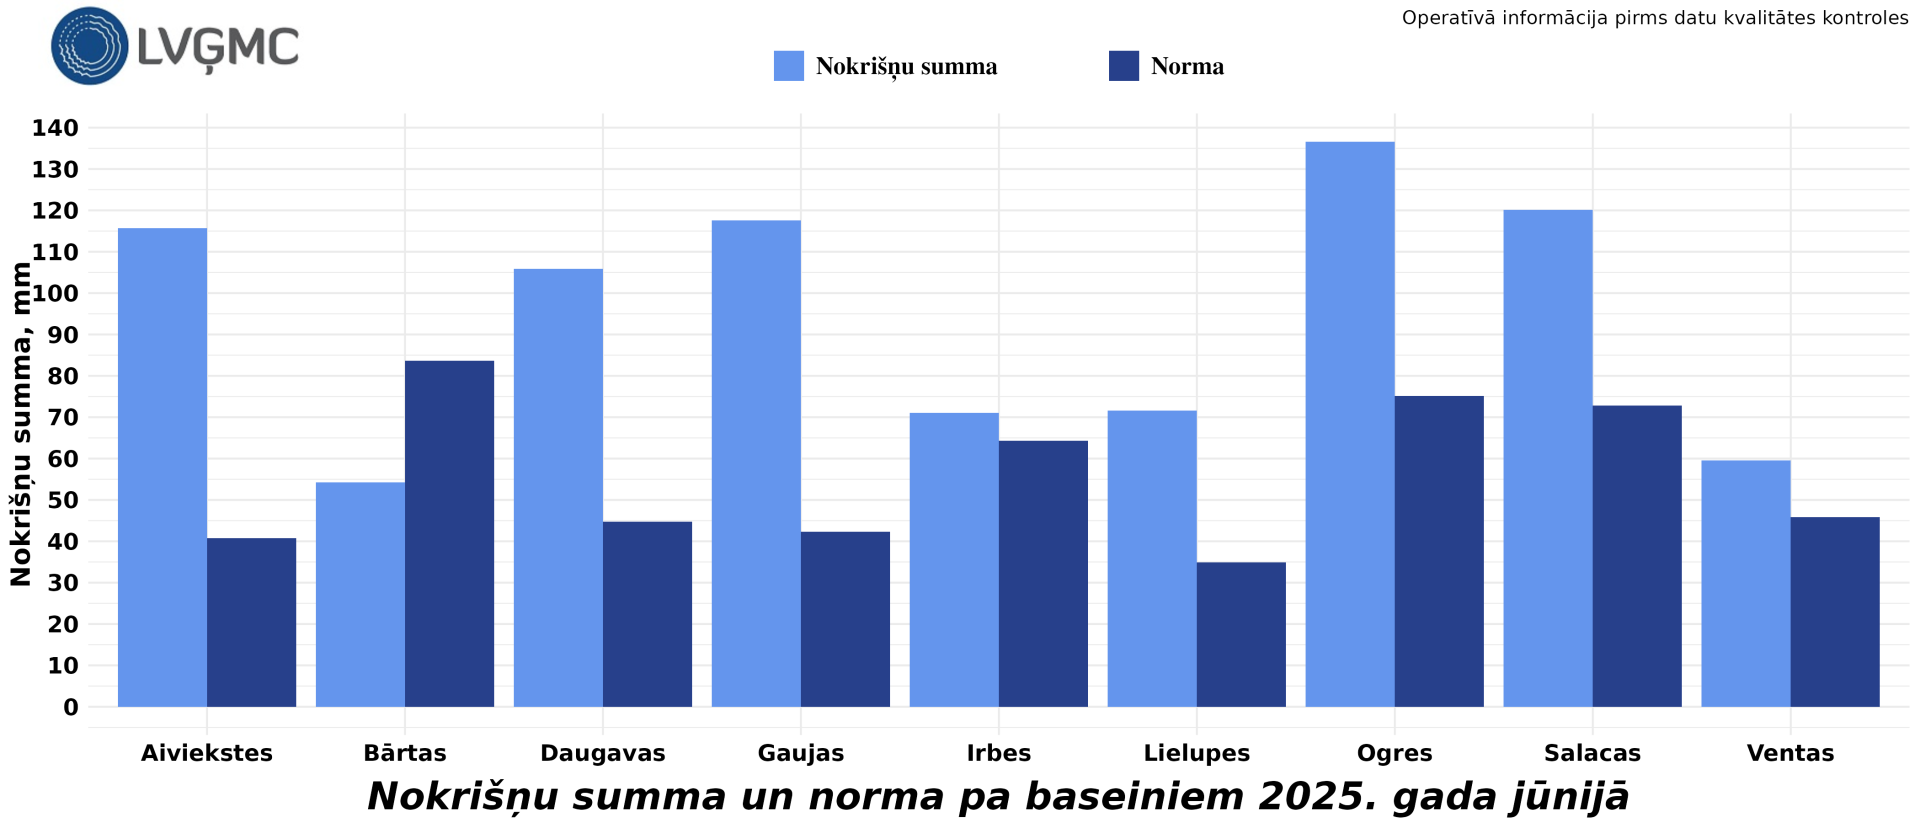
Compared to the long-term average, the lowest amount of precipitation in June was observed in Bārta basin, where precipitation amounted to 65% of the norm. It was significantly wetter in Irbe, Venta, Salaca, and Ogre basins, where the observed precipitation was above the long-term average: 111–182% of the monthly norm. Meanwhile, an even greater amount of precipitation was recorded in Lielupe, Daugava, Gauja, and Aiviekste basins: 205–284% of the monthly norm.

Table 7: This chart shows precipitation totals compared to the norm across different river basins in Latvia for June 2025. The light blue bars represent the actual precipitation amounts. The dark blue bars represent the long-term norm. It highlights where rainfall was above or below the usual levels for each basin (Ogre and Gauja basins had much more rainfall than normal, while Lielupe and Venta had less).

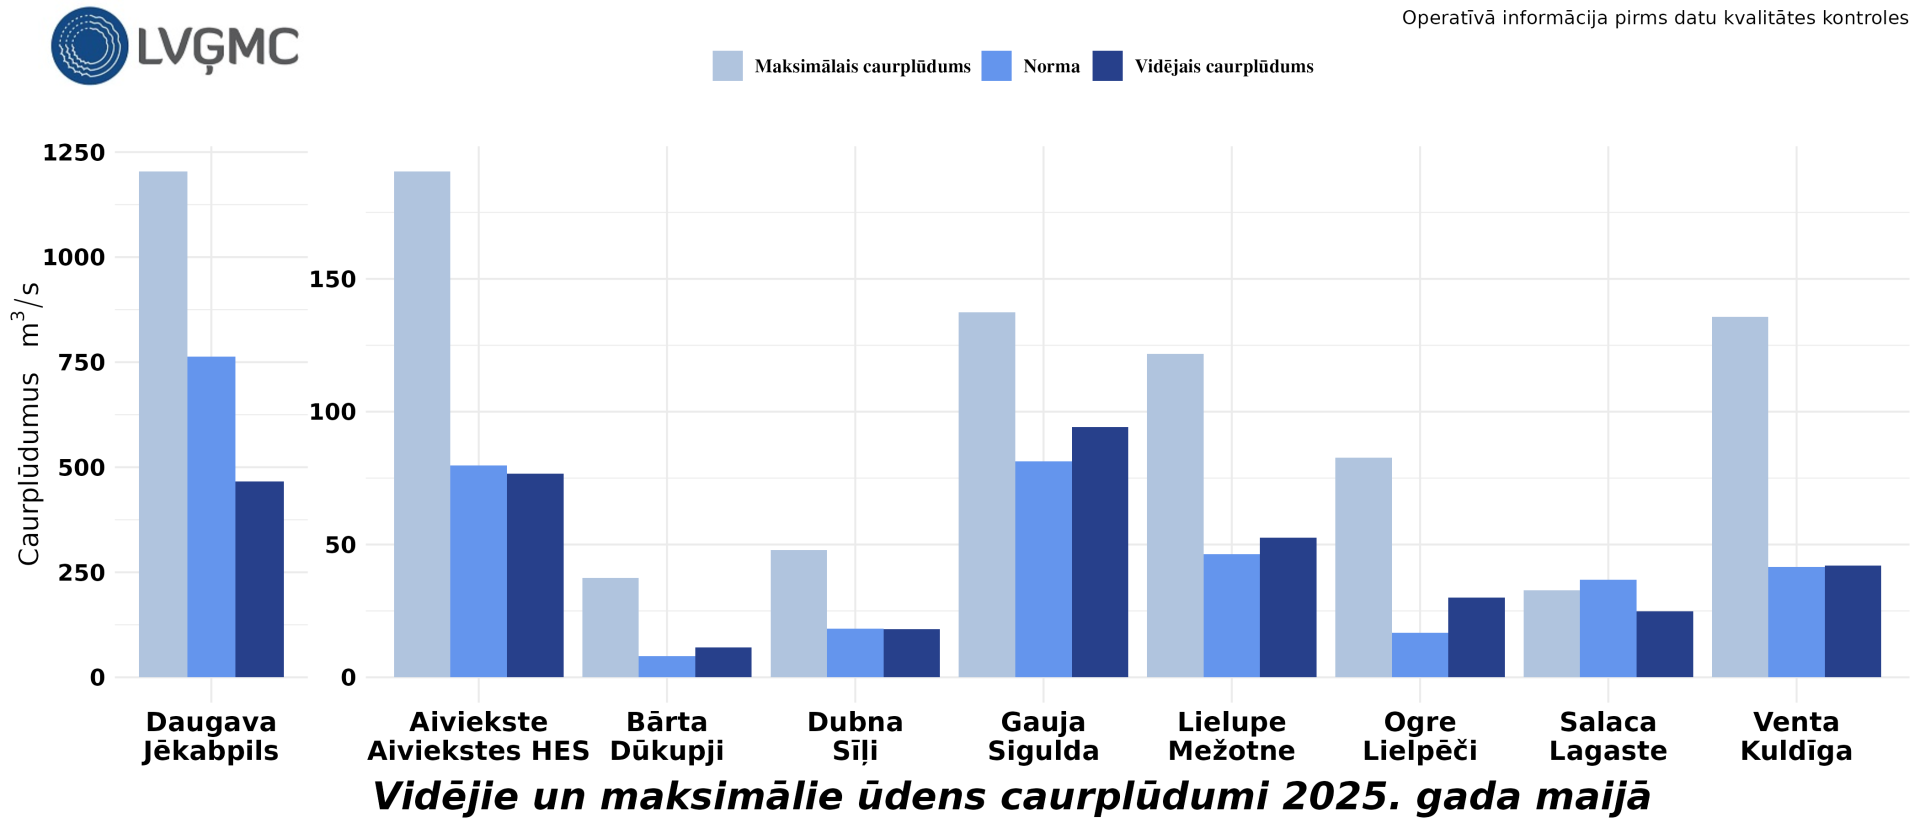
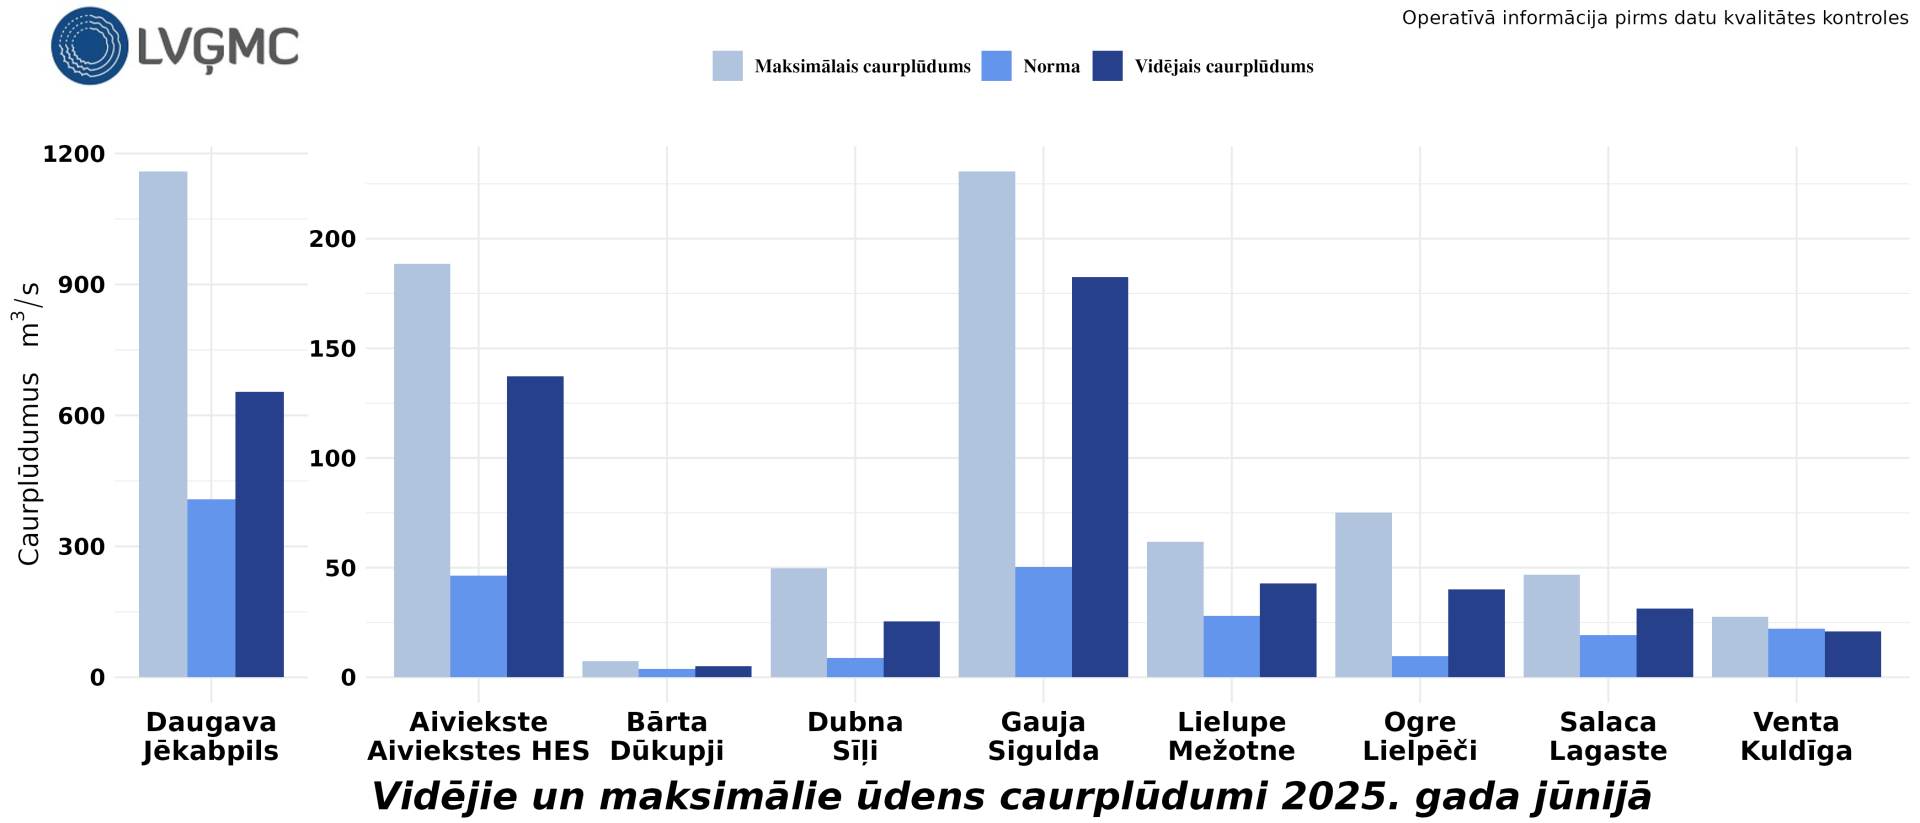
In June, the average river runoff mostly remained well above the long-term average indicators. Only in Venta runoff stayed slightly below the norm – 94%. In other river basins, water level was considerably above the norm – in Bārta, Lielupe, Daugava, and Salaca basins: 131–163% of the norm. Even higher water level was observed in Dubna and Aiviekste basins: 290% and 295% of the norm, respectively. Meanwhile, extremely high water level was recorded in Gauja and Ogre basins: 363% and 415% of the norm, respectively. In many places, the maximum river runoff in June was similar to that usually observed in spring floods.

Table 8: This chart shows the average and maximum water discharges in different rivers of Latvia for June 2025, compared with the norm. Light blue bars: maximum discharge. Medium blue bars: long-term norm. Dark blue bars: average discharge. Some rivers had significantly higher flows than the norm.

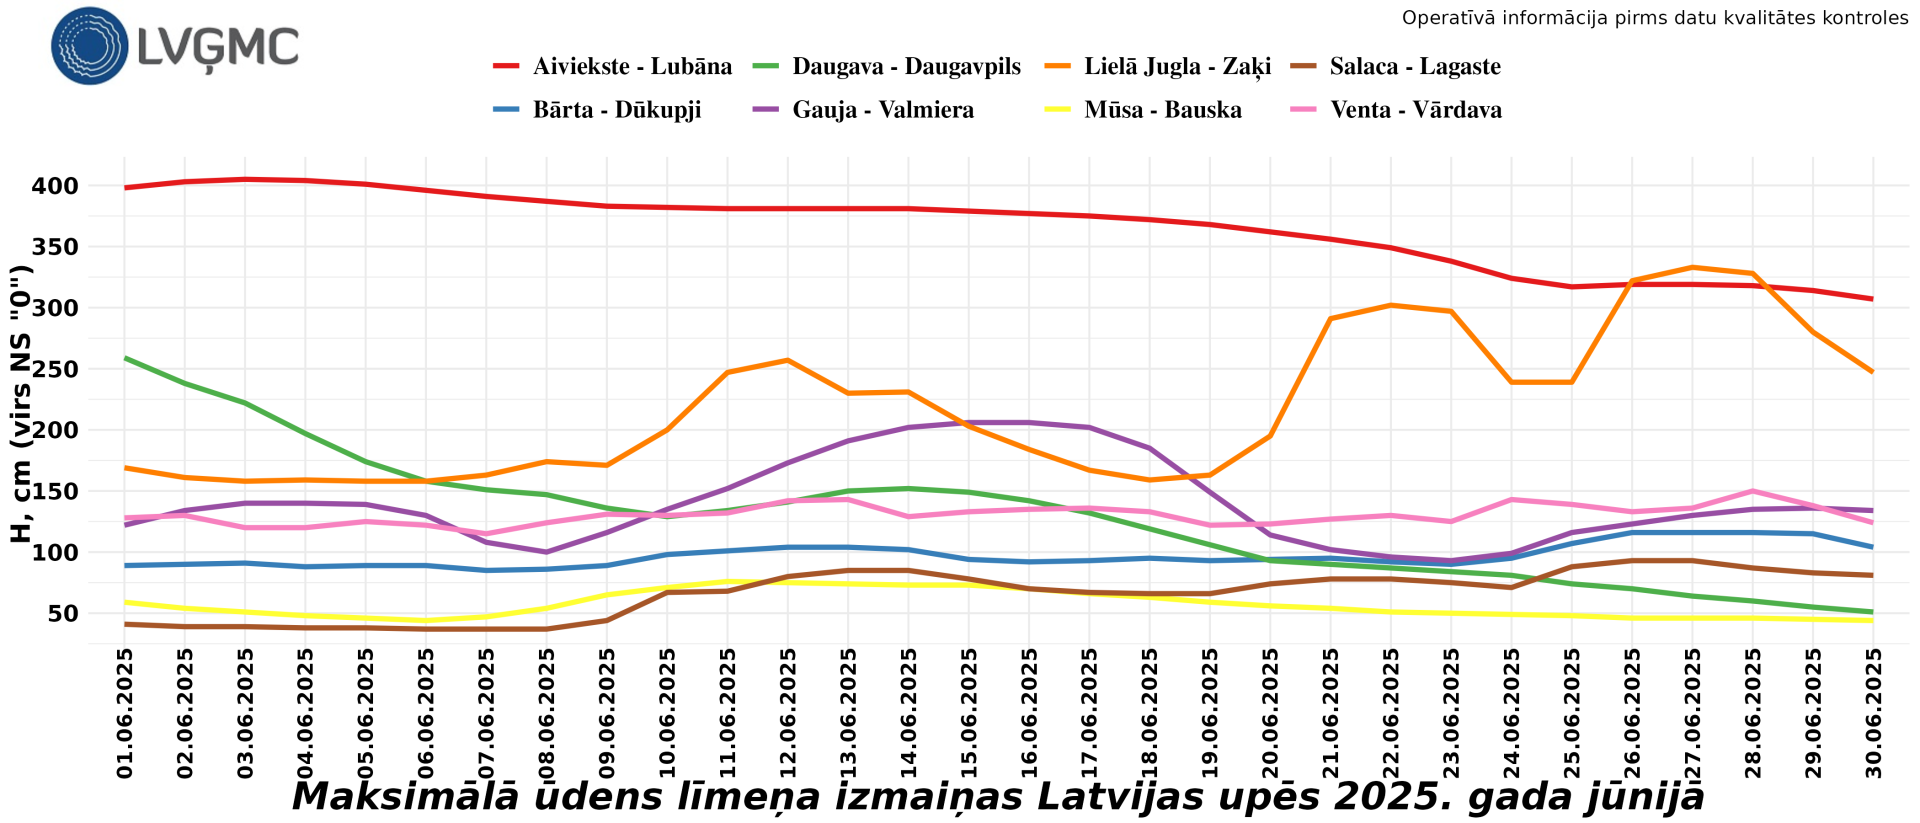
In the last week of May, as well as in the first half of June, several precipitation zones reached Latvia, bringing heavy rains in many places, especially in the eastern part of the country. After the rainfall in the eastern part of Latvia, in Latgale and Vidzeme, large areas in the countryside and low-lying areas on the banks of water bodies, especially in Gauja and Daugava river basins, were flooded for a long time.

At the beginning of June, yellow-level warnings were issued for high water levels in the eastern part of the country.

By the middle of the month, water levels in the rivers had stabilized; however, at the end of June (especially during Midsummer), heavy rains again affected large areas, and river water levels began to rise. In the rivers of the eastern part of the country, water levels remained raised throughout the month, and a low-water period did not occur.

At the beginning of the month rain washed out roads. Fields and gardens were flooded, farmers had rotten crops.

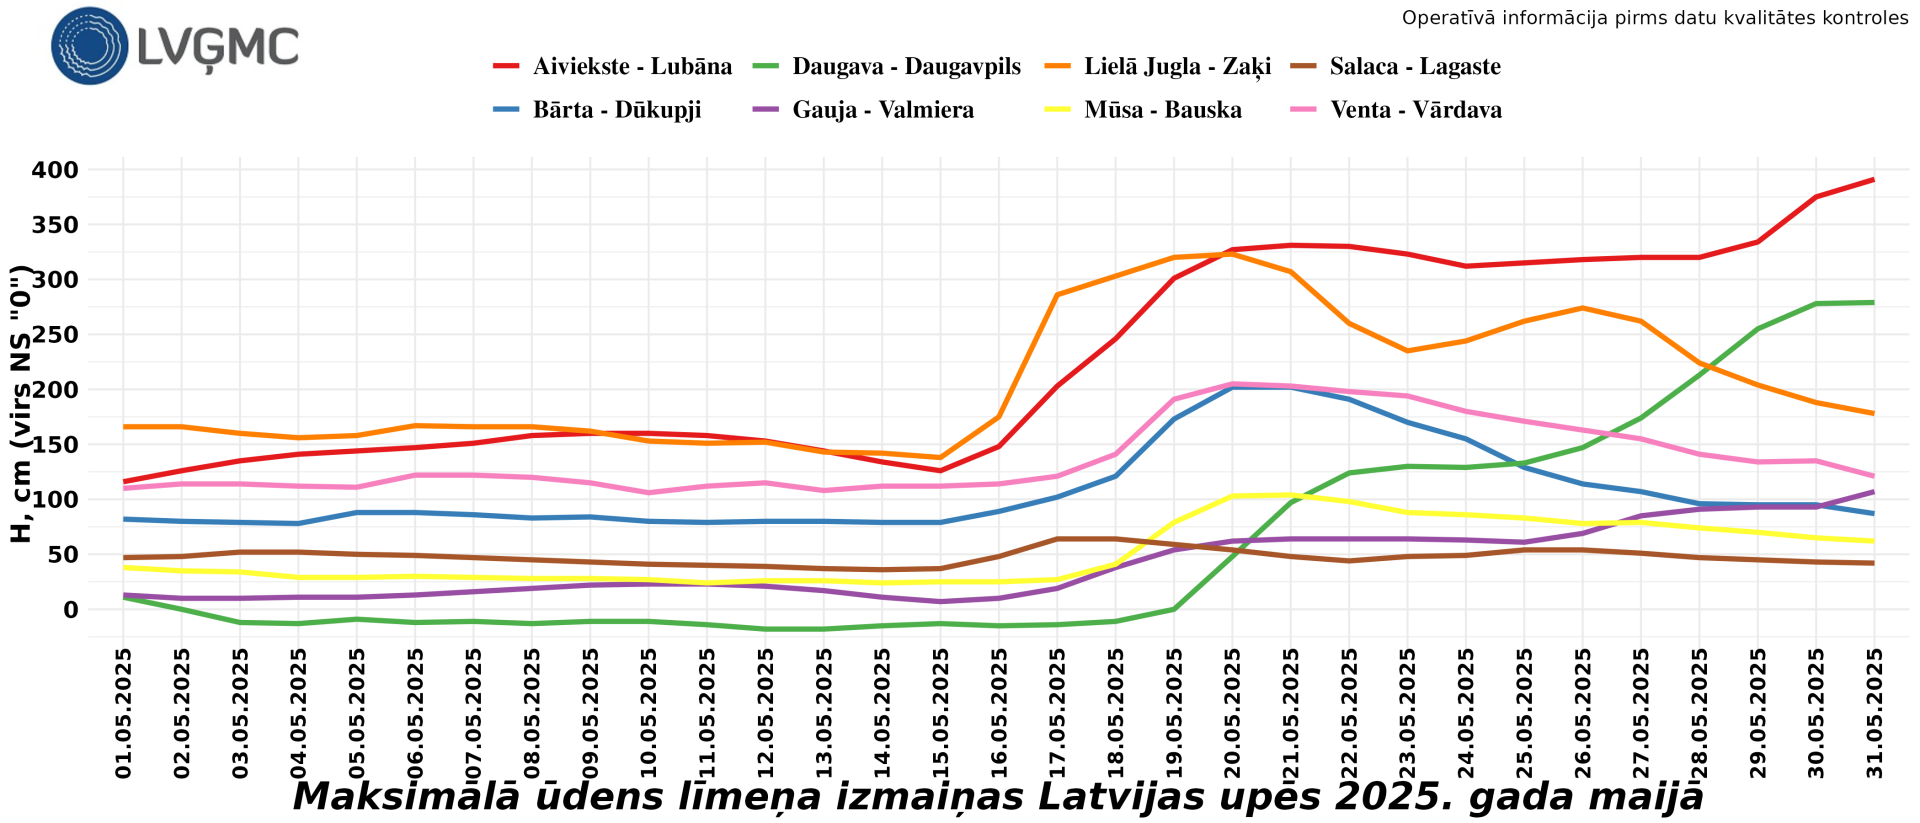
Table 9: This graph shows changes in maximum water levels in different rivers of Latvia during June 2025. Each colored line represents a river monitoring station (Aiviekste–Lubāna, Daugava–Daugavpils, Gauja–Valmiera, etc.). The vertical axis shows water level. The horizontal axis shows days in June 2025. It illustrates how river water levels fluctuated over the month.

According to information from LEGMC, the situation did not improve in July either. The total precipitation in Latvia during the first ten days of July was 25.6 mm, which is 12% above the decade’s norm (22.8 mm). The most rainfall (73.8 mm) was recorded in Zīlāni, while the least was in Kuldīga – 5.3 mm. On average, Latvia experienced 3.9 days with at least 1 mm of precipitation during the first ten days of July. The highest number of such days was recorded in Alūksne, Priekuļi, and Zīlāni – 6 days, while the fewest were in Dobele, Kolka, Kuldīga, Mērsrags, and Stende – 2 days.

Table 10: This map shows deviation of precipitation amounts in Latvia during the first 10 days of July 2025, compared to the long-term average for 1991–2020. Western and central Latvia (orange/yellow areas) had significantly less rainfall than normal. Eastern Latvia (green/blue areas) had much more rainfall than normal.

The total precipitation in Latvia during the second ten days of July was 35.1 mm, which is 40% above the decade’s norm (25.1 mm). The heaviest precipitation (92.1 mm) was recorded in Kalnciems, while the least was in Stende – 2.2 mm. On average, Latvia experienced 3.9 days with at least 1 mm of precipitation during the second ten days of July. The highest number of such days was recorded in Daugavpils and Rucava – 7 days, while the fewest was in Stende – 1 day.

Latvijas karte ar nokrišņu daudzuma atzīmēm

Table 11: This map shows precipitation deviation in Latvia during the 2nd ten days of July 2025, compared to the 1991–2020 average. Western and central Latvia had much less rainfall than normal. Eastern Latvia had far more rainfall than normal.

The total precipitation in Latvia during the third ten days of July was 46.2 mm, which is 67% above the decade’s norm (27.7 mm). The heaviest rainfall (102.1 mm) was recorded in Stende, while the least was in Zosēni – 12.4 mm. On average, Latvia experienced 5.1 days with at least 1 mm of precipitation during the third ten days of July. The highest number of such days was recorded in Gulbene – 8 days, while the fewest were in Mērsrags, Sigulda, Ventspils, and Zosēni – 3 days.

Table 12: This map shows precipitation deviation in Latvia during the 3rd ten days of July 2025, compared to the 1991–2020 average. Western and parts of central Latvia received much more rainfall than usual. Eastern and some central regions had less rainfall than normal.

After the recent rains, water levels in the water bodies of eastern and central Latvia remained raised for an extended period, and large areas of fields and low-lying places along the banks of water bodies were flooded. Calculations by the Copernicus European Flood Awareness System (EFAS) indicate that by the end of July an abnormally high amount of moisture had accumulated in the soil in eastern Latvia, as well as in some areas of South Kurzeme and Liepāja regions.

Data from LEGMC show that the Standardized Precipitation Index (SPI) in eastern Latvia was extremely high over a three-month period. When the soil becomes too wet, it can no longer absorb water during rainfall. As a result of the long-term regular inflows of rainwater, the water levels in rivers have increased. Since mid-July, several yellow-level warnings for high water levels in water bodies have been issued.

Table 13: This map shows  Standardized Precipitation Index (SPI) for Latvia over a 3-month period (May 1 – July 31, 2025), which reflects dryness and wetness levels. Blue areas indicate wetter than normal conditions, ranging from moderately wet to extremely wet. Light areas in western Latvia show conditions close to normal. The dark blue in eastern Latvia represents strongly above-average moisture (very wet to extremely wet).

According to information from LEGMC rains continued in August. The total amount of precipitation in Latvia in the first decade of August was 24.0 mm, which is 11% above the decade’s norm (21.7 mm). The most precipitation (70.1 mm) was recorded in Gulbene. On average, Latvia experienced 3.8 days in the first decade of August with at least 1 mm of precipitation. The highest number of such days was in Madona – 7 days, while the fewest were in Skulte – 1 day.

Table 14: This map shows precipitation anomaly in Latvia for the first 10 days of August 2025, compared to the long-term average (1991–2020). Orange/yellow areas indicate below-average rainfall. Green areas show rainfall close to normal. Blue areas indicate much wetter than usual conditions.

The current situation indicates that at the end of August, prolonged rainfall is occurring in the western part of the country (Kurzeme).